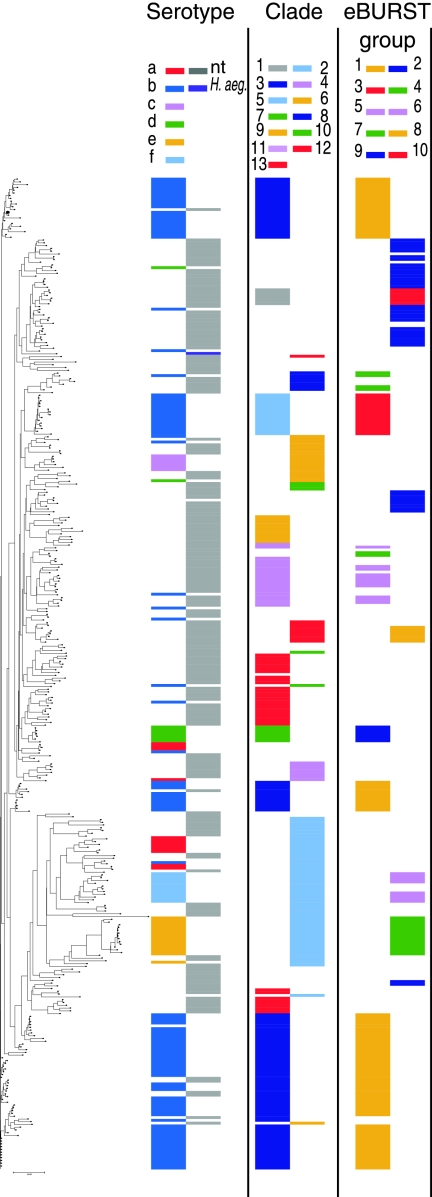
FIG. 3.
Comparison between different analyses of the complete MLST database. The dendrogram was generated from MLST sequences by the neighbor-joining method, using software in the START2 suite of MLST analytic tools. In alignment with each ST on the tree is plotted the serotype of associated strains, and the assignment of the ST to clade and eBURST group as previously described is indicated. Table S1 in the supplemental material lists the position of each ST on this tree and on three other trees generated using other programs in START2.

