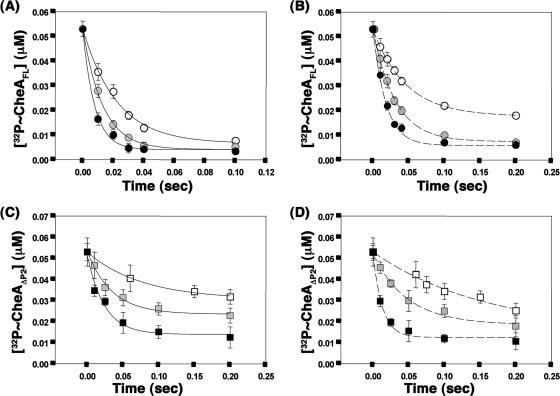
FIG. 4.
Single exponential fits to representative data for phosphotransfer from P∼CheA to CheY. Phosphoryl transfer from P∼CheAFL (A and B) or P∼CheAΔP2 (C and D) to CheY was assayed with 1.4 μM CheY (white), 4.7 μM CheY (gray), or 18.8 μM CheY (black) in the absence (A and C) or presence (B and D) of 2 mM CheZC15 peptide. Single exponential fits used for estimation of kobs are shown. Within each experiment, two aliquots from each time point were analyzed on separate gels, and results were averaged. The data points shown are average values from two independent experiments with the standard errors indicated.

