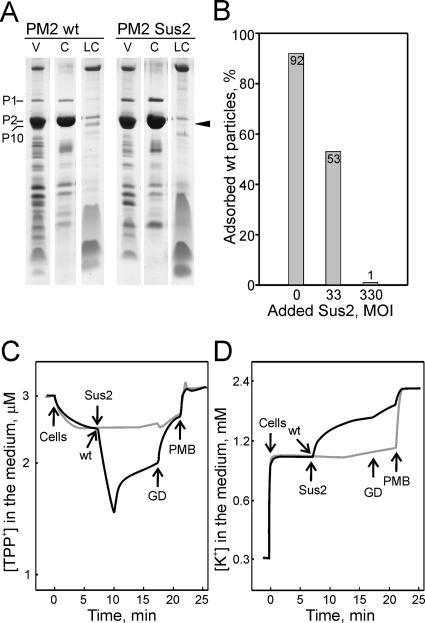
FIG. 4.
Phenotype of the PM2 sus2 mutant. (A) Analysis of the protein content of purified wt PM2 and mutant Sus2 virus particles by Tricine-SDS-PAGE and Coomassie blue staining. V, purified virus particles; C, released capsid components; LC, lipid core. The position of P10 is depicted with an arrowhead. The positions of PM2 proteins are indicated. (B) Phage adsorption to ER72M2 cells in the presence of Sus2 particles. The percentages of adsorbed wt particles after a 10-min adsorption period are shown. (C and D) Wt PM2 and mutant Sus2 induced changes in the envelope permeability of ER72M2 cells to TPP+ (C) and K+ (D) ions. The measurements were carried out at 28°C with a cell concentration of ∼6 × 10⁸ CFU/ml. ER72M2 cells were infected with either wt (black curve) or Sus2 (gray curve) virus particles using an MOI of ∼20. GD and polymyxin B sulfate (PMB) were added to a final concentration of 5 μg/ml and 25 μg/ml, respectively.

