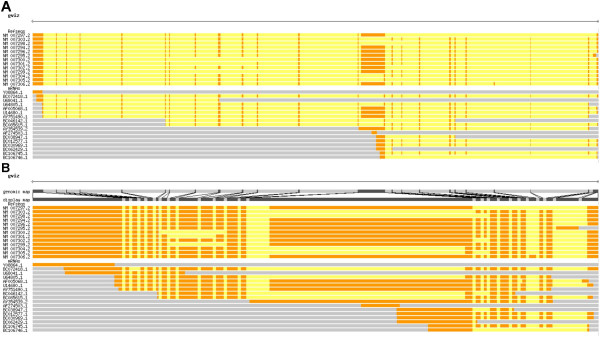
Figure 2.
Example of the trackCorrelate function to help visualize splice variants. RefSeq and other mRNAs from the human gene BRCA1 are shown aligned to the genome (a) and after compressing introns (b). After compression, it is much easier to see the different isoforms and, for example, discover that mRNAs BC072418.1 and AF005068.1 are not represented among the RefSeqs.

