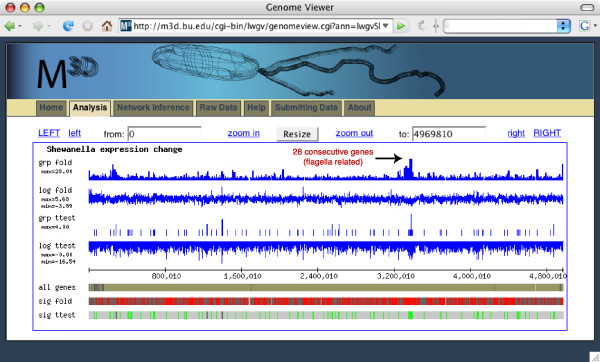
Figure 3.
lwgv is used with the Many Microbe Microarrays Database to allow users to dynamically display expression changes in their chromosomal context. In this example, significant expression changes between E. coli cells grown in rich media and E. coli cells grown in rich media with norfloxacin antibiotic are shown with lwgv. In this chromosomal context, it is immediately clear that several large regions of the genome have significantly changed expression levels between these two conditions. For example, over 28 consecutive genes and intergenic regions related to flagella have a significant fold change (track grp fold). These significantly changed genes are displayed on track sig fold.

