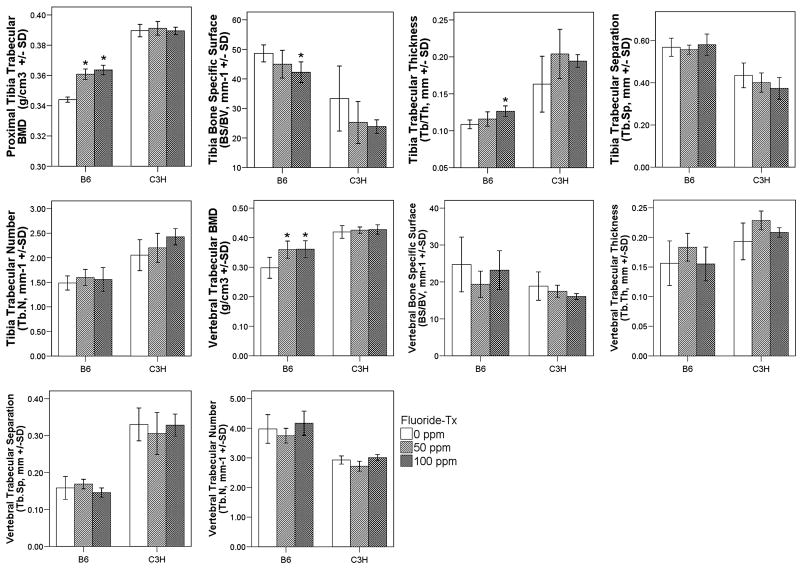
Figure 4.
Trabecular bone morphology and BMD in the regions of the proximal tibia and lumbar vertebrae from different F treatment groups of C3H and B6 mice. Values are means ± SD, n = 6 per treatment group/control. *: significant difference (p < 0.05) between current F treatment group and control (0ppm) group. White boxes (0ppm), light grey (50ppm), and dark grey (100ppm)

