Figure 3.
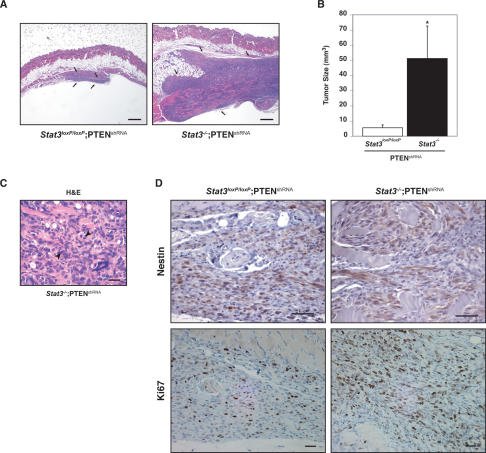
STAT3 suppresses PTEN deficiency-induced malignant cell transformation. (A,B) Stat3loxP/loxP;PTENshRNA or Stat3−/−;PTENshRNA astrocytes were injected subcutaneously into SCID mice. Eight weeks after injection, tumors were removed, measured, and stained. STAT3 loss induced an increase in tumor size as revealed by hematoxylin and eosin (H&E) staining (A) and tumor size measurements (n = 8; t-test, [*] P < 0.05) (B). Arrows in A show the tumor limits. Bar, 1 mm. (C) Histologic analysis of the Stat3−/−;PTENshRNA tumors by H&E staining. The tumors showed histologic features of neoplastic transformation including nuclear atypia, pleomorphism, and frequent mitotic figures (arrowheads). Bar, 100 μm. (D) Nestin and Ki67 immunostaining of Stat3loxP/loxP;PTENshRNA and Stat3−/−;PTENshRNA tumors. These tumors express nestin, a characteristic marker of glial tumors. Cell proliferation rate, as measured by the percentage of Ki67-positive cells, was higher in Stat3−/−;PTENshRNA tumors as compared with Stat3loxP/loxP;PTENshRNA tumors (64% vs. 25%, respectively; average of two tumors each). Bar, 100 μm.

