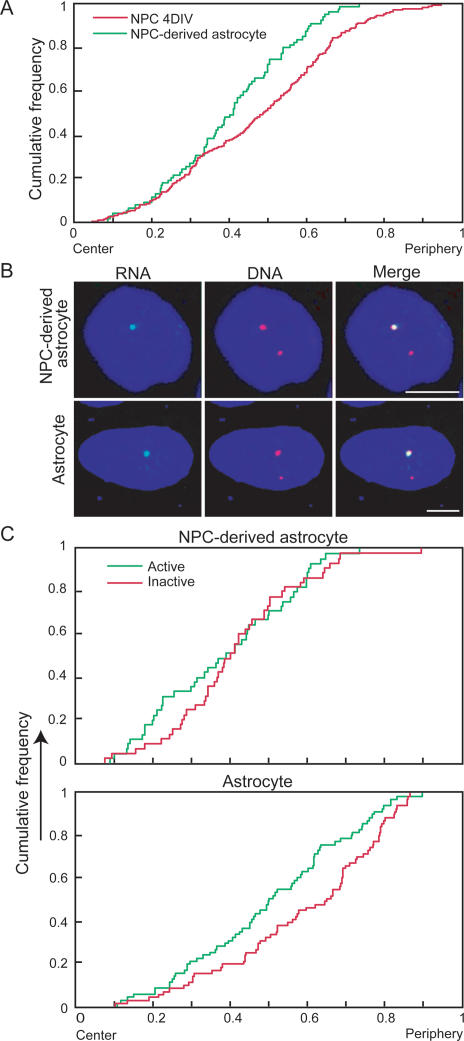
Figure 4.
Spatial nuclear positioning of GFAP alleles. (A) Cumulative distribution graphs of the radial position of GFAP alleles in NPC cultured for 4 d in vitro (4DIV) and NPC-derived astrocytes. N = 45, 138. (B) Representative images of NPC-derived astrocytes and primary astrocytes with only a single active GFAP allele. (Green) RNA; (red) DNA FISH. The active allele is preferentially internally located compared with the inactive allele. (C) Cumulative distribution graphs of the radial position of active and inactive alleles in NPC-derived astrocytes and primary astrocytes. N = 45, 72. Bars, 5 μm.

