
Fig. 4.
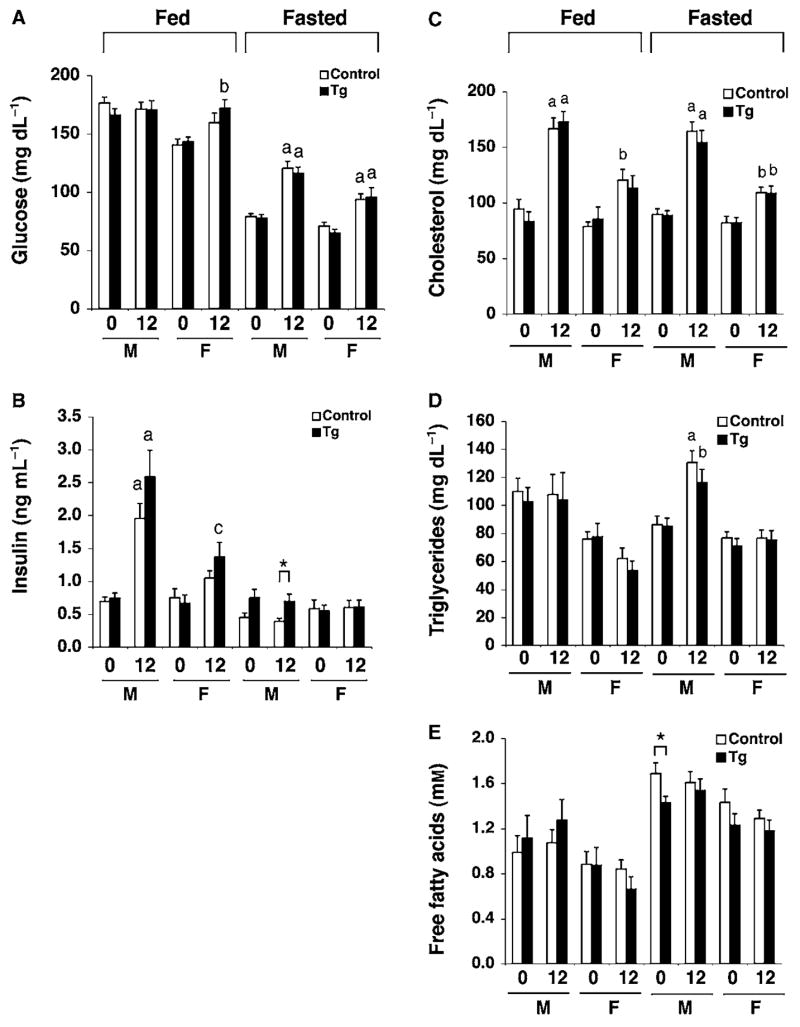
Plasma glucose, insulin, and lipid levels in BESTO transgenic and control mice fed a Western-style, high-fat diet (HFD). (A) Fed and fasted plasma glucose levels in male (M) and female (F) BESTO (black bars) and control (white bars) mice from line 431-4 before (0) and after (12 weeks) a HFD regimen. For fed glucose levels, n = 12–15. For fasted glucose levels, n = 5–15. (B) Fed and fasted plasma insulin levels in male (M) and female (F) BESTO (black bars) and control (white bars) mice before (0) and after (12) a HFD regimen. For fed insulin levels, n = 4–12. For fasted insulin levels, n = 5–15. a, P ≤ 0.001; b, P ≤ 0.01; c, P ≤ 0.05, compared to glucose or insulin levels before HFD feeding. (C–E) Fed and fasted plasma (C) cholesterol (D) triglycerides, and (E) total free fatty acid levels in male (M) and female (F) BESTO (black bars) and control (white bars) mice from line 431-4 before (0) and after (12 weeks) an HFD regimen (n = 6–15). a, P ≤ 0.001; b, P ≤ 0.01, compared to values before HFD feeding. All results are expressed as mean ± standard error. *P ≤ 0.05.