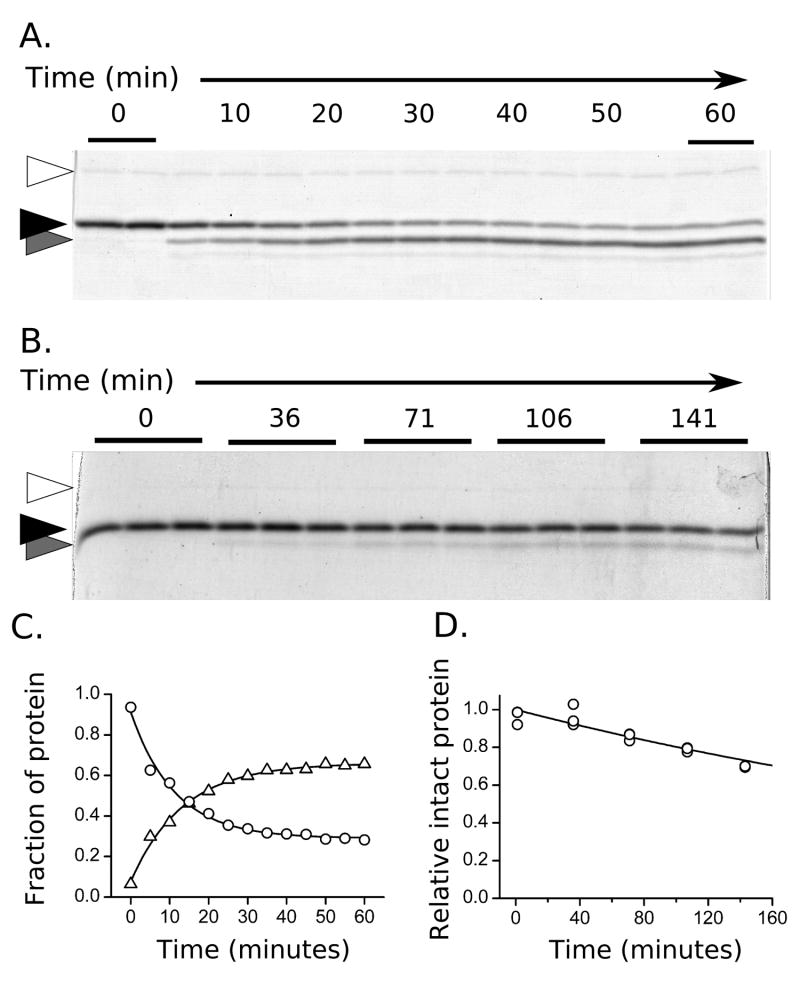
Figure 3.
Hydrolysis of HBV capsid protein monitored with SDS-PAGE. A) The progression of proteolysis in the presence of high concentrations of enzyme (37°, dimer). Trypsin (open arrow), intact Cp149 (black arrow), and the cleavage product (gray arrow) are indicated. Alternating time samples (5 min spacing) are labeled, and first and last lanes are run in duplicate. B) Experiments for determination of observed rate constants (kexp) are restricted to less than 30% cleavage (25°C, capsid). Multiple sampling replicates for each time point are run to estimate quantitation error. C) Quantitation of the bands shown in A. The disappearance of the intact protein (circles) and appearance of product (triangles) follow first order kinetics. D) Gel band intensities from B were fit to an exponential decay to determine rate.

