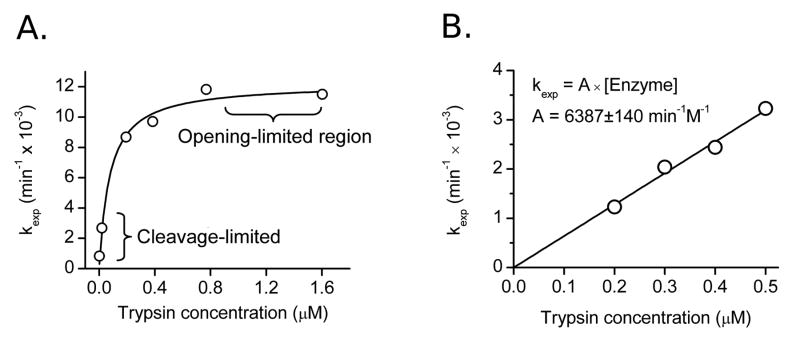
Figure 4.
Determination of Kop and kopen from observed rate constants plotted versus trypsin concentration. A) Over a wide range of concentrations the data can be described by a hyperbola. Under opening-limited conditions kexp approaches a fixed limit: these plots are fit to the full kinetic equation (Equation 7), giving Kop and kopen values. Data shown is for dimer at 37°C. B) In cleavage-limiting conditions, plots of kexp are linear with respect to enzyme, with a slope of Kop·kcat/KM. Data shown is for capsid at 37°C.

