
Figure 4.
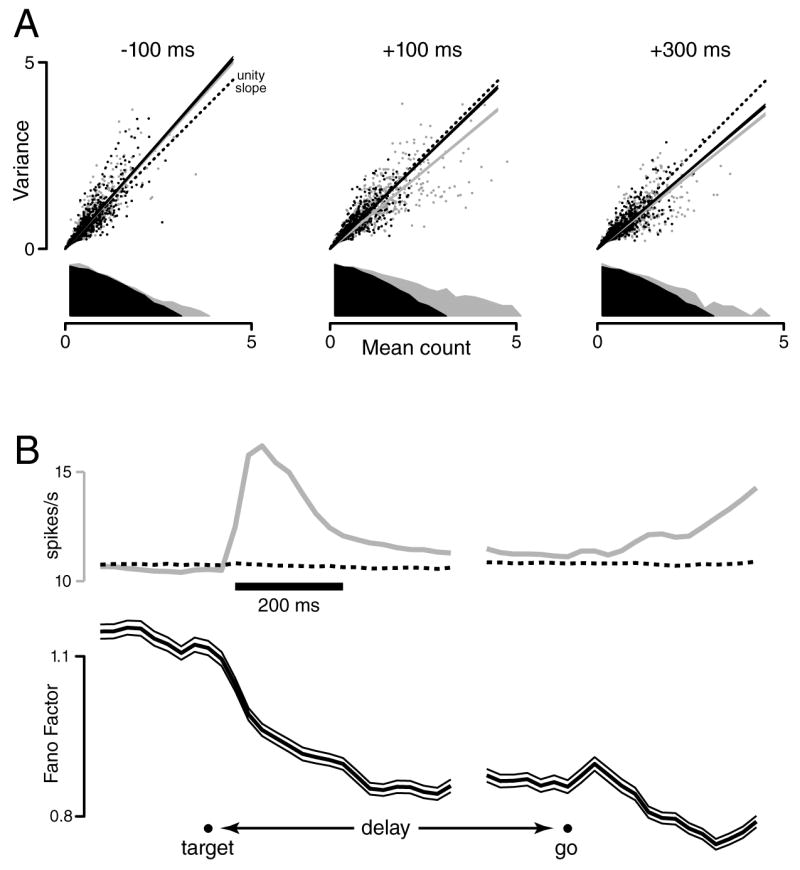
Across-trial neural variability during a delayed-reach task. A. Scatterplots of spike-count variance versus mean, using a 50 ms sliding window (one dot per neuron/target-location). For clarity, only 25% of the 4264 points are plotted). The grey marginal distribution plots, on a log vertical scale, the distribution of mean counts. Three plots are shown, with the window centered 100 ms before, 100 ms after, and 300 ms after target onset. The slope of the variance/mean relationship (grey line) is reduced following target onset. That reduction is still present (black line) when distributions of mean counts are down-selected to match across times (black dots/distributions). B. Mean firing rate (grey, across all neurons/condition) and the Fano Factor (black, with flanking 95% CIs,) as a function of time. The Fano factor is the slope of the linear regression (black lines in A), after matching the distribution of rates across times. The dotted trace plots the mean firing rate after that matching, which by construction changes very little. Even for the unrestricted mean (grey), the overall firing rate changes only modestly, as it is computed across both preferred and non-preferred conditions, and across responses of both signs. Analysis was performed with data locked to target onset (left) and the go cue (right). A break appears in the plot due to the variable delay period.