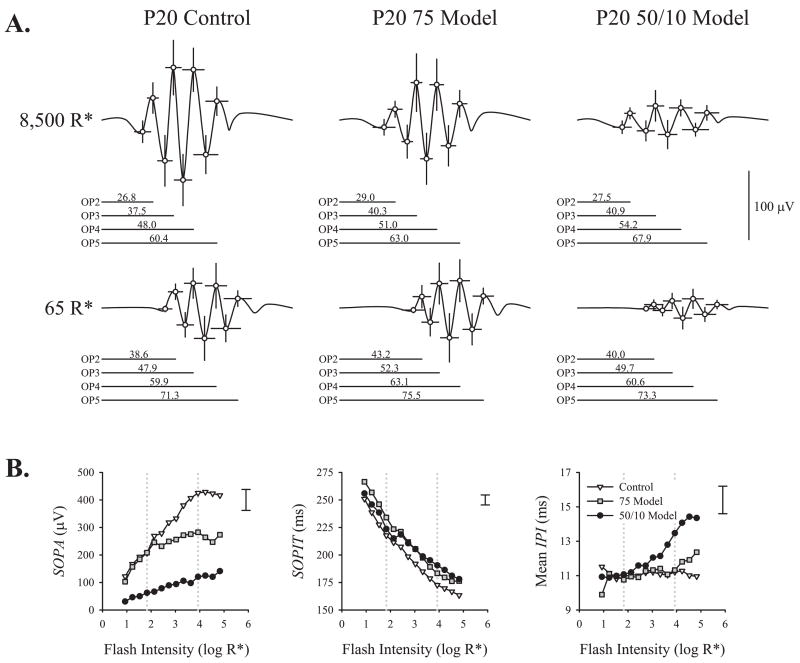
Figure 2.
Time domain analysis. (A) Mean (±SD) OP2, -3, -4, and -5 trough and peak amplitudes and implicit times plotted for P20 control, 75 model, and 50/10 model rats’ responses to the 8500 R* and 65 R* stimuli. In this display, the points are connected with a spline curve (SigmaPlot 10; Systat Software, Inc., San Jose, CA) to simulate average OPs. The mean implicit time for each OP peak is indicated below each record. (B) Mean SOPA, mean SOPIT, and mean IPI (periodicity) are plotted as a function of flash intensity. Dotted lines: intensities shown in (A). Error bars at the top right of each panel indicate the average ± SEM across groups at 8500 R*. Error at other intensities was a similar proportion of the mean.

