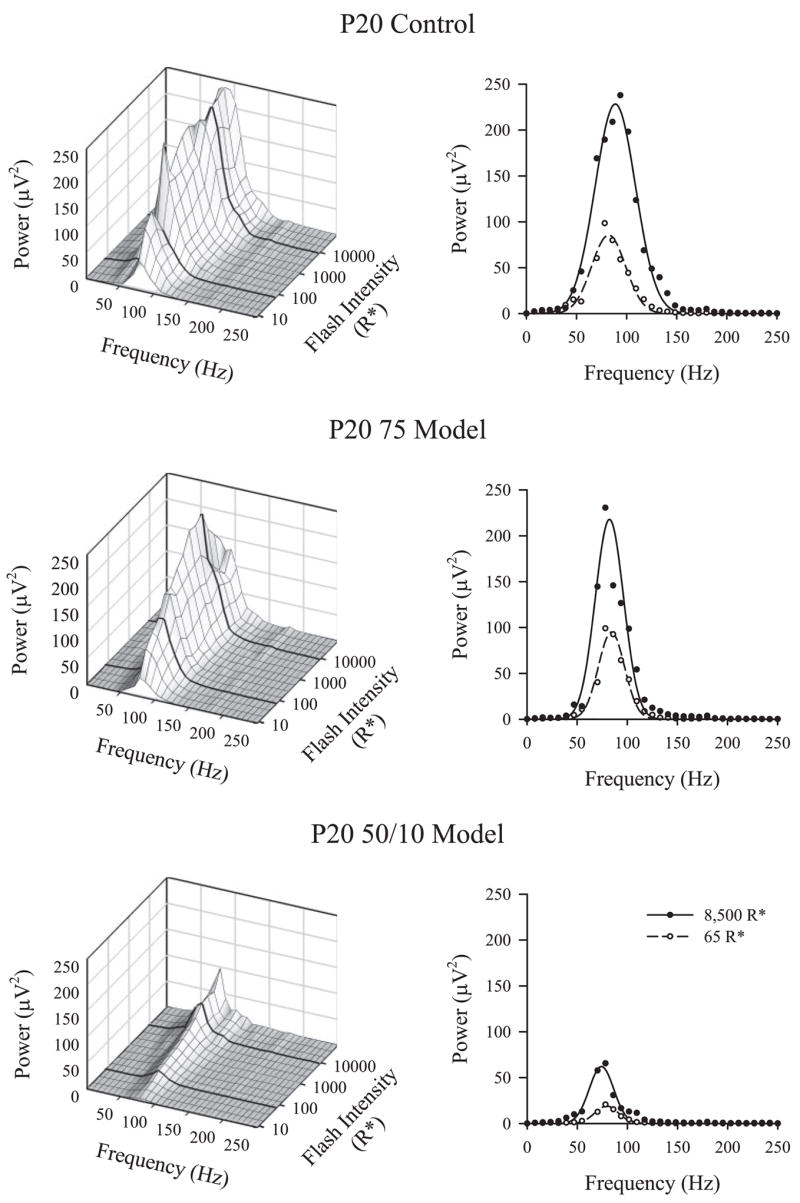
Figure 3.

Frequency domain analysis. Left: the mean OP power as a function of frequency and intensity for P20 control, 75 model, and 50/10 model rats. Bold lines: 8500 R* and 65 R* stimulus levels. Right: replot the frequency domain responses (circles) to these stimuli with fits of equation 2. The area under the curve (equation 3) indicates OP energy.
