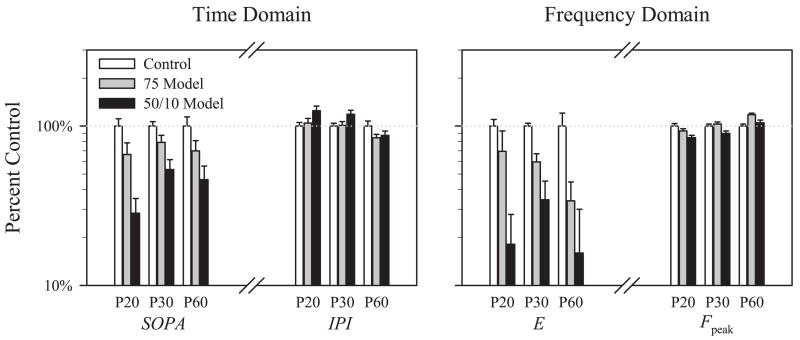
Figure 4.
The time domain parameters SOPA and SOPIT and frequency domain parameters OP energy (E) and dominant frequency (Fpeak) plotted as a percentage of the control (+SEM) at each test age (P20, P30, and P60) for 75 model and 50/10 model rats. The control mean for each parameter is 100% (dotted line).

