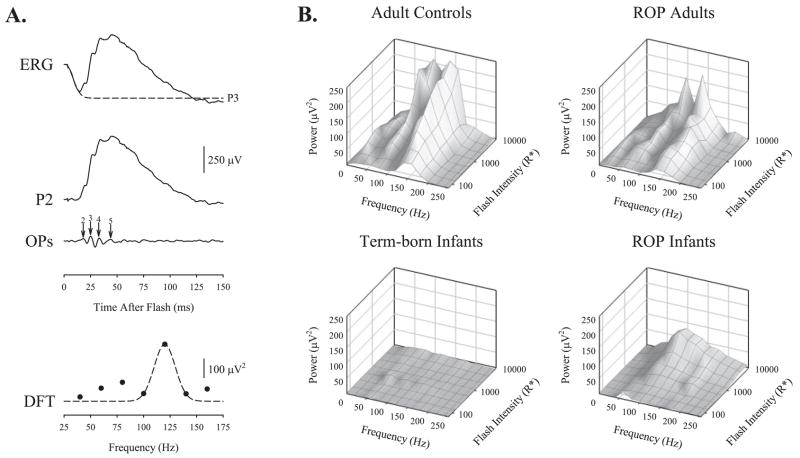
Figure 6.
The OPs in human subjects. (A) Extraction of the time and frequency domain OPs in a healthy adult subject. The steps are as described in Figure 1. (B) Mean OP power plotted as a function of frequency and intensity for healthy adult controls, adults with a history of ROP, healthy term-born infants, and age-matched infants with a history of ROP. The adult power spectra are bimodal.

