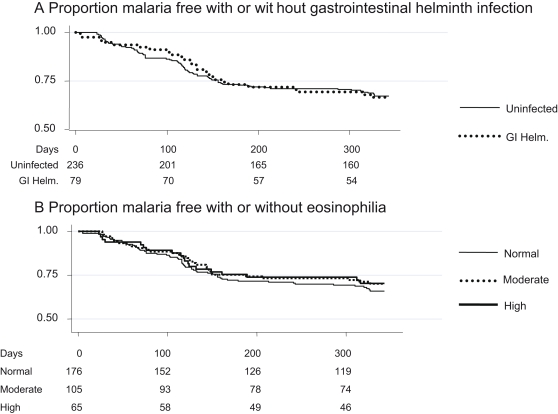
Figure 1. The probability of remaining free of clinical malaria is plotted over the 9 months of monitoring.
Numbers of children at risk are given below the Kaplan Meier plots. Both plots use an endpoint of >2,500 parasites per microlitre and fever. Plot a) compares the probability of remaining free of clinical malaria for children with gastrointestinal helminth infection (GI Helm.) and uninfected children. Plot b) compares the probability of remaining free of clinical malaria for children with normal eosinophil counts (below 0.5×10⁶ per ml), mild eosinophilia (0.5–1×10⁶/ml) or high eosinophilia (above 1×10⁶/ml). The survival curves are not significantly different by unadjusted log-rank testing (p = 0.98 for gastrointestinal worm infection, p = 0.71 for eosinophilia).

