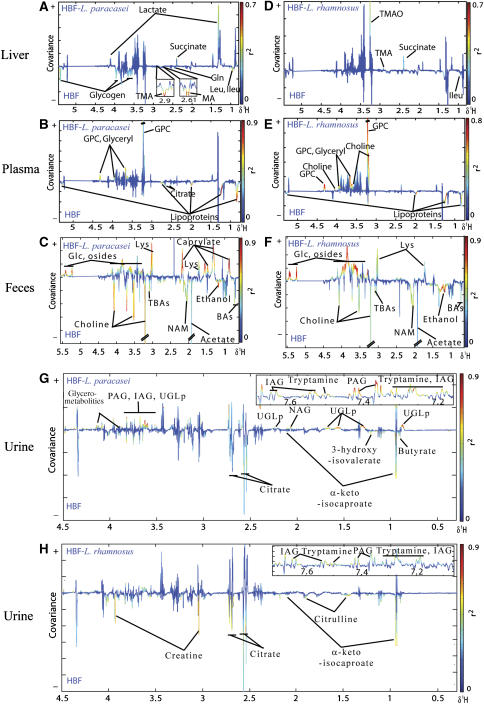
Figure 1.
O-PLS-DA coefficient plots derived from 1H MAS NMR CPMG spectra of liver (A, D), 1H NMR CPMG spectra of plasma (B, E), 1H NMR standard spectra of fecal extracts (C, F) and urine (G, H), indicating discrimination between HBF mice fed with probiotics (positive) and HBF control mice (negative). The color code corresponds to the correlation coefficients of the variables with the classes. BAs, Bile acids; DMA, dimethylamine; Glc, glucose; Gln, glutamine; GPC, glycerophosphorylcholine; IAG, indoleacetylglycine; Ileu, isoleucine; Leu, leucine; Lys, lysine; NAG, N-acetylated glycoproteins; NAM, N-acetylated metabolites; Osides, glycosides; PAG, phenylacetylglycine; TBAs, taurine conjugated to bile acids; TMA, trimethylamine; TMAO, trimethylamine-N-oxide; UGLp, unidentified glycolipids.

