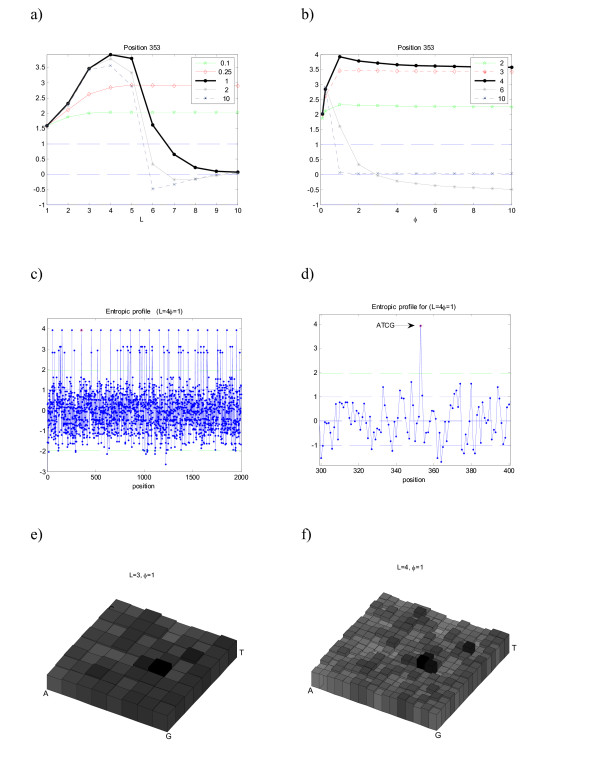
Figure 1.
Entropic profile (EP) for sequence m4. Artificial DNA sequence with implanted motif "ATCG" in positions [50i...53i+100], i = 0, ..., 19 (see Table 1). Several parameter combination L and φ are presented, and the corresponding EP values are plotted a) as a function of L for several φ and b) as a function of φ (for the same L values). The maximum values of normalized estimations g vary along the positions. In this example, position 353 corresponds to the last symbol of one (randomly chosen) occurrence of motif ATCG, and its EP attains a maximum value for L = 4 and φ = 1, with more than 3.5 standard deviations from the mean densities (EP θ(353) = 3.8). c) and d) The complete profile for these parameter values, showing the peaks on the implanted suffix ATCG. The most representative parameter values are plotted. e) and f) The CGR densities obtained from the profiles using the fractal kernel described.

