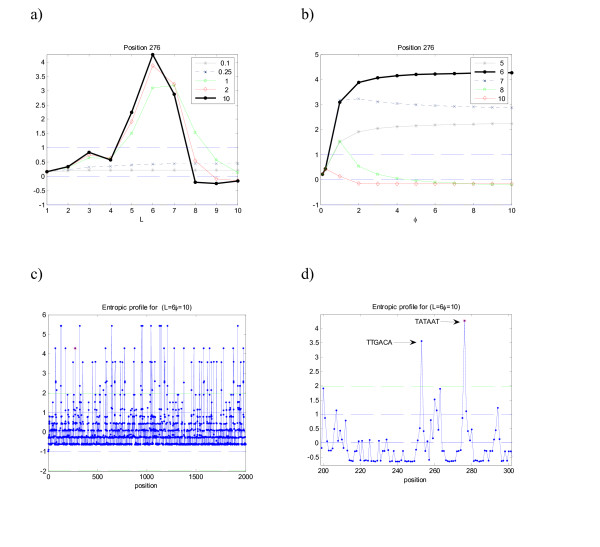
Figure 4.
Entropic profile (EP) for sequence Es of the promoter regions in B. subtilis. The peaks in the EP correspond to the structured motif TTGACA-TATAAT. This particular position is well conserved so that the motif is easily detected. Other positions where the motif is degenerated do not exhibit a similar conservation and clear profile. The highest peaks in panel c) correspond to the motif 'AAAAAA', which is repeated more often in the sequence than the previous ones. The overlapping capacity of this motif can partially explain this behavior.

