
Figure 5.
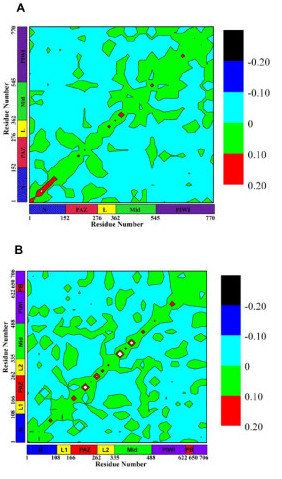
Pair correlations of atomic displacements calculated using Equation (3): (a) Pf-Ago, (b) Aa-Ago. Regions of high (red), medium (green), and low (blue) correlations are shown. Black represents large anti-correlation. The self-correlation (diagonal line) often has the highest value. The area and shape of off-diagonal islands are measures of the extent to which the motions of different domains are correlated.