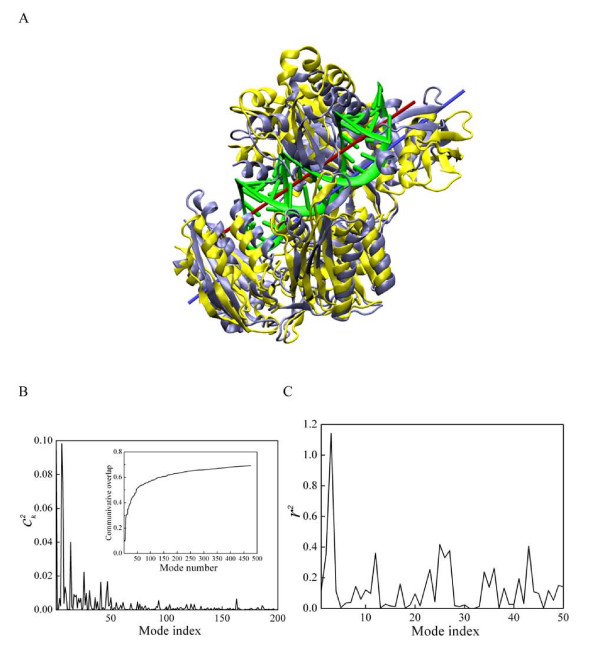
Figure 7.
a) A model of Aa-Ago bound to guide DNA-mRNA. The hybrid duplex is colored in green, with the central red bar as its axis. As a comparison, the protein structure in its apo-form conformation is colored in light gray, and the one containing the hybrid duplex (model) is colored yellow. The yellow structure has an orientation similar to that in Figure 4b). b) The normal mode representation of the Cα conformational changes of Aa-Ago in adopting DNA-mRNA duplex. The coefficient was calculated using Equation (5). The inset shows the cumulative contribution to the Cα conformation change by each mode. c) The radius change of the imaginary cylinder, which encloses Cα atoms located within 5 Å of the DNA-RNA duplex in panel a).

