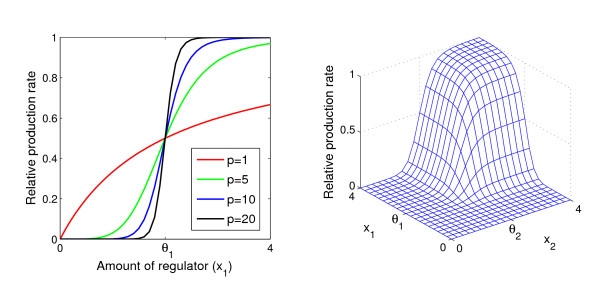
Figure 1.
Regulatory functions used in the simulations. (a) The Hill function describes the dose-responce relationship between the amount of a regulator x1 and the relative production rate of the regulated gene. The threshold parameter θ1 = 2 is the same for all four curves. (b) Regulatory function for two regulators x1 and x2. Two Hill functions are combined by the algebraic equivalent of the Boolean AND function (see Table 1). The parameter values used in this panel are θ1 = θ2 = 2 and p = 10.

