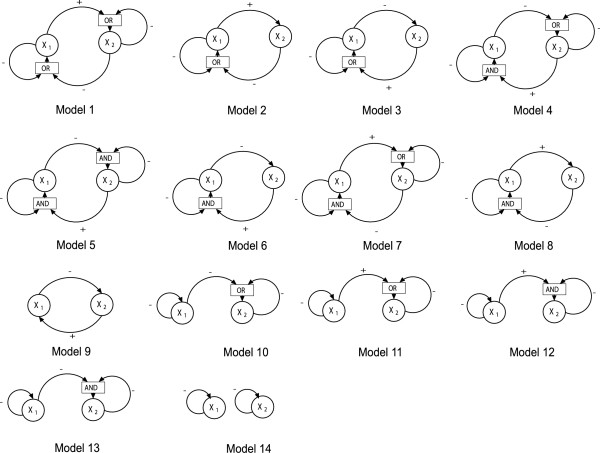
Figure 3.
Connectivity diagrams for the 14 network models in the simulation study. Genes 1 and 2 are represented by circles, the downstream gene 3 being omitted for clarity. The sign of an arrow indicates whether the type of regulation is activation (+), in which case the input variable is Zi, or inhibition (-), in which case the input variable is 1 - Zi. When a gene has two regulators, the individual signals are combined with a logic block, represented by a rectangle, merging the two signals into one by the continuous analogue of the Boolean functions AND or OR. (See the Methods section for explanations of the Boolean variables and functions.)

