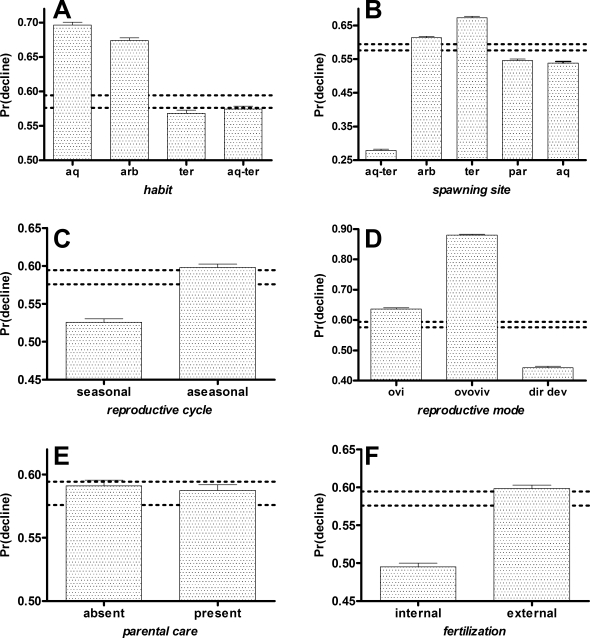
Figure 3. Predicted probabilities of population decline for the life history terms habit, spawning site, reproductive cycle, reproductive mode, presence/absence of parental care and fertilization type (derived from the nine-term model BS+RG+RG2+HB+SS+RC+RM+PC+FT based on the BIC-selected top-ranked model; see Table 2).
The observed extinction probability 95% confidence interval (dotted horizontal lines) was determined by a 10,000 iteration bootstrap of the probabilities predicted by the above model over 3,052 species. Changes to extinction probability relative to each term level were calculated by adjusting the original dataset so that all species were given the same value for that level (each level value in turn), keeping all other terms in the model as in the original dataset. Error bars represent the 10,000 iteration bootstrapped upper 95% confidence limits. aq = aquatic, arb = arboreal/phytotelms, ter = terrestrial, aq-ter = aquatic & terrestrial, ovi = oviparious, ovoviv = ovoviviparous, dir dev = direct development. See text and Supplementary Table S3 for a description of variables.

