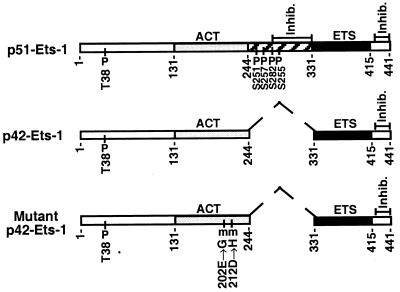
Figure 1.
Schematic representation of the protein structure for p51-ETS1, p42-ETS1, and mutant p42-ETS1. The DNA-binding domains of ETS1 protein (ETS) are indicated by solid regions. The transcriptional activation domains (ACT) are indicated by lightly shaded regions (26). Hatched boxes indicate domains (amino acids 244–331) encoded by exon VII (25), which is deleted in p42-ETS1 and indicated by dashed line. Amino acid numbers are indicated below each protein. The domains inhibiting DNA binding are indicated by “inhib.” (27). Phosphorylated threonine and serine residues are indicated by a “P” (28), and mutation sites in mutant p42-ETS1 are indicated by an “m” (29).

