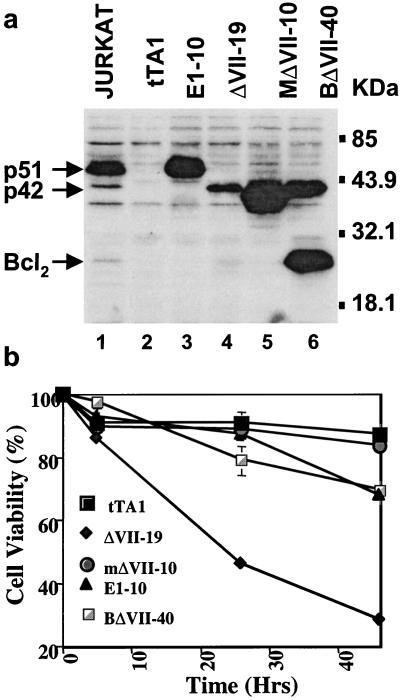
Figure 3.
Protein levels and cell viability of p42-ETS1, p51-ETS1, mutant p42-ETS1, and p42-ETS1/bcl2 transfectants. (a) Comparison of protein expression levels of different transfectants. DLD1 cells were transfected with control vector (tTA1, lane 2), p51-ETS1 (E1–10, line 3), p42-ETS1 (ΔVII-19, lane 4), or mutant p42-ETS1 (mΔVII-10, lane 5) and cotransfectant p42-ETS1/Bcl2 (BΔVII-40, lane 6). Approximately 2 × 10⁵ cells were obtained from the individual clones and lysed, and the same amount of protein was electrophoresed and detected with a polyclonal antibody, C-20 to ETS1 (Santa Cruz Biotechnology) or N-19 to bcl2 (Santa Cruz Biotechnology). Jurkat cells were the positive control (lane 1). Molecular weight markers are shown on the right. (b) Cell viability after treatment with anti-Fas mAb CH-11. DLD1 cells expressing the control vector tTA1 (■), p51ETS1 (▴), p42-ETS1 (⧫), mutant p42-ETS1 (●), and p42-ETS1/Bcl2 (□) were placed in a 96-well plate and incubated with anti-Fas antibody CH-11 (100 ng/ml) at times as indicated. Cell viability was measured by MTT assay. Each data point is the mean of three independent experiments.

