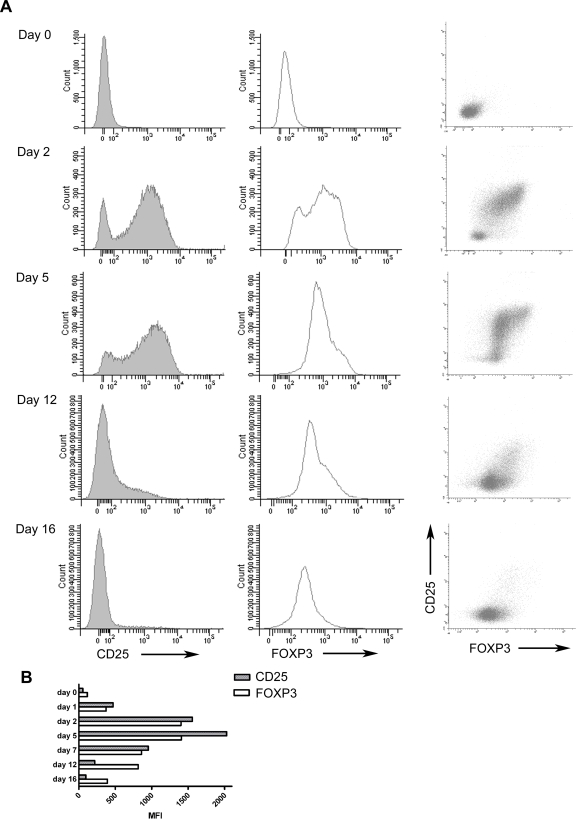
Figure 5. Transient expression of FOXP3 and CD25 in stimulated CD4+CD25lo cells from male donors.
Plots showing results from one representative donor out of four analyzed. (A) FACS analysis of CD4+CD25lo cells stimulated at day 0 with CD3/CD28 Dynabeads (proportion cell∶beads 1∶1) in presence of 180 U IL-2. Stimuli removed after 48 h and cells followed for an additional 2 weeks with regards to their expression of CD25 (left) and FOXP3 (middle). Left column demonstrating the relationship between CD25 (y-axis) and FOXP3 (x-axis) expression. (B) Expression of CD25 (grey filled bars) and FOXP3 (open bars) in stimulated cells as described above, displayed as mean fluorescent intensity (MFI).

