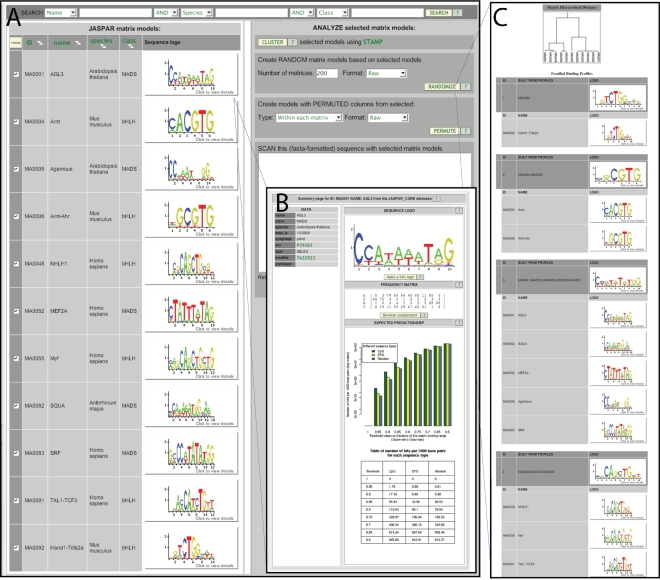
Figure 1.
New features in the JASPAR database web interface. (A) A listing of matrices in the JASPAR-CORE database resulting from selection of MADS and bHLH-type factors. These models are used in the clustering analysis in panel C. (B) A pop-up window showing detail information on the MA0001 model, with expected predictions/bp statistics. (C) Dynamic clustering of selected profiles. At the top, a dendrogram describing the similarities of the input profiles is shown. Clusters of similar modes are merged into familial binding profiles, shown below. In this case, two larger clusters are produced, corresponding to bHLH and MADS type matrices. Two smaller clusters correspond to outliers in both groups.

