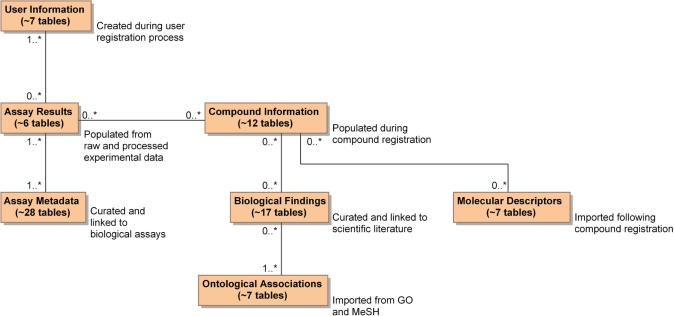
Figure 1.
Conceptual summary of ChemBank schema. Logical illustration of ChemBank data model, in which 95 tables are organized into groups representing components of the chemical biology research enterprise. Each box represents several actual database tables, as indicated, and pseudocardinality relationships between boxes are meant to convey conceptual relationships, rather than the more complex cardinality relationships that relate the actual tables.

