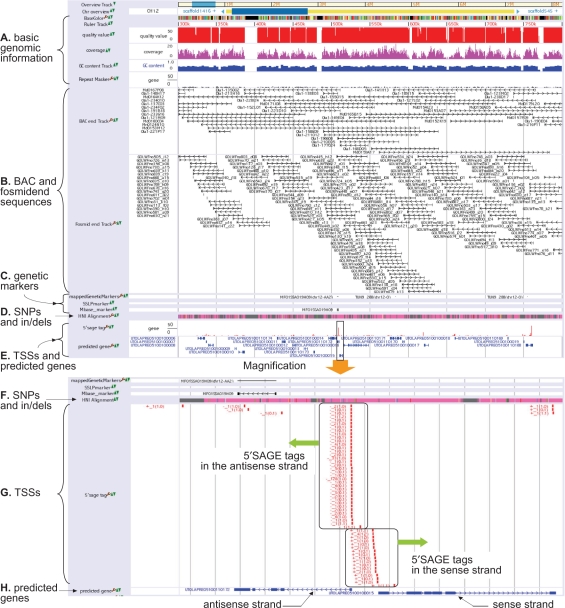
Figure 1.
Snapshot of UTGB/medaka. (A) Basic genomic information such as bases, quality values and sequence coverages of individual bases, GC content and repeats. (B) Positions of BAC and fosmid end sequences. Right (or left) arrows mean that the BAC/fosmid clone is in the sense (antisense) strand. (C) Single nucleotide polymorphism (SNP), single sequence length polymorphism (SSLP) and restriction fragment length polymorphism (RFLP) markers. (D) SNPs and insertions/deletions between medaka inbred strains Hd-rR and HNI. Details are shown in the magnification view (Figure 1F). (E) In the upper row, the height of a red bar presents the number of 5′SAGE tags observed at the position, while the lower row displays genes predicted from TSSs identified by 5′SAGE tags. The range enclosed in the box is magnified and shown in the lower portion. (F) SNPs and indels. Pink indicates matched bases, while mismatches are highlighted by green, yellow, blue and red that represent A, C, G and T, respectively, in the HNI genome. Cyan indicates the two possibilities, deletions from the HNI genome or insertions into the Hd-rR genome, though the settlement requires comparison with the genome of an outgroup of Hd-rR and HNI. Gray means the failure of the alignment because of low quality bases in either of the two genomes or lack of HNI reads in the region. (G) The positions of individual 5′SAGE tags are illustrated by red boxes. The label associated with each 5′SAGE tag is of the form S_F (L0, L1), where S indicates whether the tag is derived from the sense (+) or the antisense strand (−) of the position, F is the frequency of occurrences of the tag in the collection from a mixture of cDNA, and L0 (L1, resp.) means the number of loci where the tag is aligned to the genome with no mismatch (with one mismatch). Tags are aligned to unique positions if L0 = 1, or L0 = 0 and L1 = 1. For example, a tag labeled with +_4(1,2) is observed four times in the tag collection, it is aligned uniquely to the plus strand of the position without mismatch, and it is also aligned to two other locations with one mismatch. A tag with −_1(0,1) occurs once in the collection and fails to map to the genome with no mismatch but maps uniquely to the minus strand of the position with one mismatch. The figure displays a large number of 5′SAGE tags are observed in both strands. (H) The structures of two predicted genes are shown. Boxes represent protein-coding exons. Right (or left) arrows indicate that the gene is encoded in the sense (antisense) strand.

