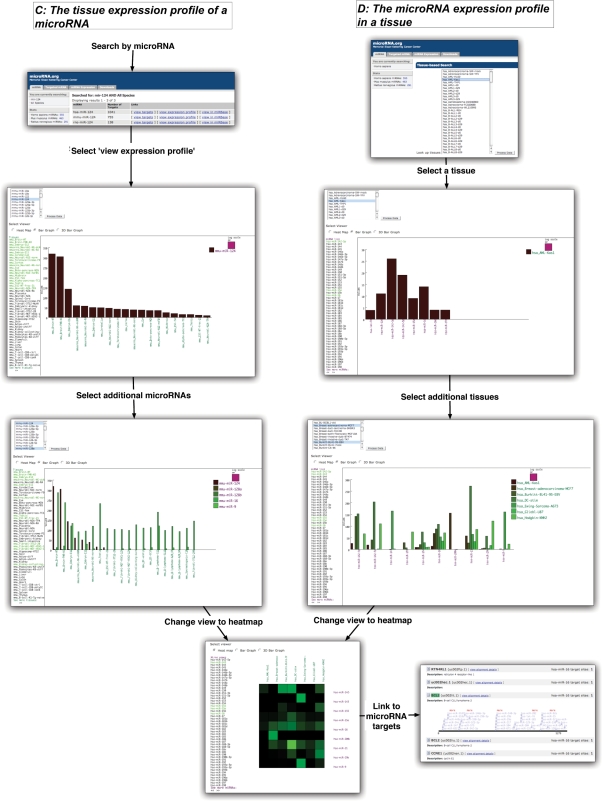
Figure 2.
Scientific use cases for exploring microRNA expression. In case C, users can select to view the ‘tissue expression profile of a microRNA’. Additional microRNAs can be incorporated into the graph from the list of microRNAs at the top of the view. Additional tissues can also be added or removed by selection from the list on the left. In the parallel instance D, users can select to ‘view the microRNA expression profile of a tissue (or a list of tissues)’. By analogous selections, users can incorporate additional microRNAs and tissues into the view from their respective lists. In both use cases, the data can be visualized as a heat map: vertical and horizontal axes represent tissues and microRNAs and colors represent microRNA expression levels. Additionally, in all views microRNAs are linked to their target view.

