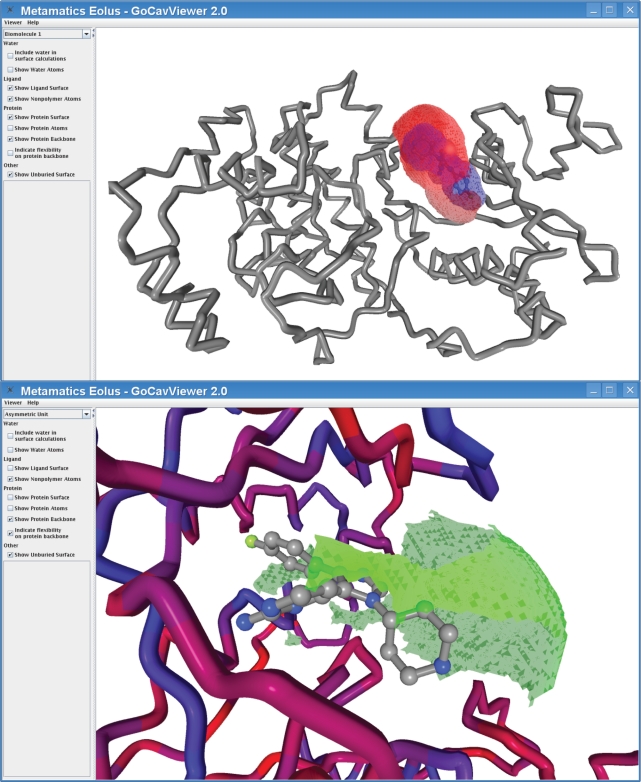
Figure 4.
EolasViewer for 3ERK. The SB4 ligand is shown in ball in stick inside the pocket. The surfaces shown are the ligand surface in blue, the binding site in red and the solvent-exposed regions of the binding site are in green. (Top) The protein backbone is shown as a gray ribbon, and in the close-up (Bottom), the backbone is colored by B-factors.

