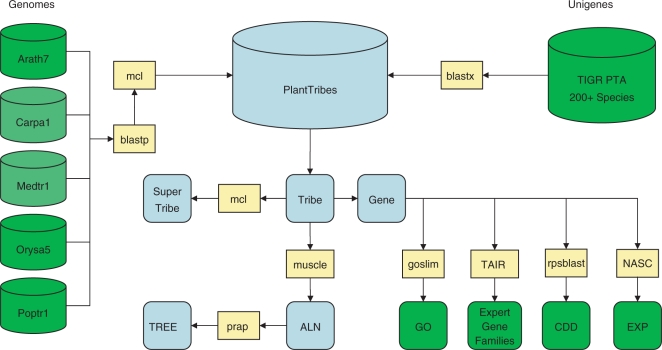
Figure 1.
PlantTribes database production. Schematic diagram detailing the process of creating the PlantTribes database. External datasets are indicated in green, ‘results’ in blue, and software in yellow. First, an all-against-all BLASTP of five sequenced plant genomes is conducted with the results sent to MCL. Taxon abbreviations: Arath7 (Arabidopsis thaliana), Carpa (Carica papaya), Medtr1 (Medicago truncatula, currently 60% complete), Orysa5 (Oryza sativa) and Poptr1 (Populus trichocarpa). Darker green for Carica and Medicago indicate that although these genomes were included in the genome scaffold, tribe results for these species will not be accessible through the web interface of PlantTribes until the public release of these genomes. Tribes are produced at low, medium and high stringencies and are annotated using Gene Ontology (GO), NCBI Conserved Domain Database (CDD) and expression data from NASCArrays (EXP). A second round of MCL clustering is performed on all tribes to group related tribes, called SuperTribes. For all tribes, protein and DNA alignments and maximum-likelihood phylogenetic trees using prap are generated. Unigene sets from the TIGR Plant Transcriptome Assemblies are searched against the fully sequenced genomes and are automatically sorted into respective tribes.

