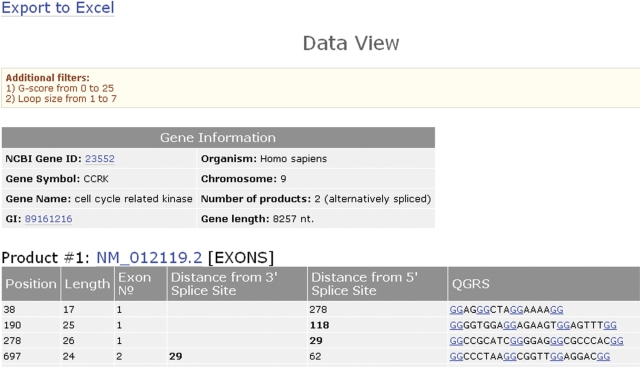
Figure 3.
GRSDB2 CCRK Data View. A listing of the nucleotide sequences for all QGRS, the location of QGRS in exons, introns and near poly(A) signals. Results are shown for each product of the gene. What is shown is a truncated image of the view. The QGRS displayed satisfy the conditions that G-scores are in the range from 0 to 25 (which in effect restricts the output to QGRS with G-groups of size 2) and loop size is in the range from 1 to 7.

