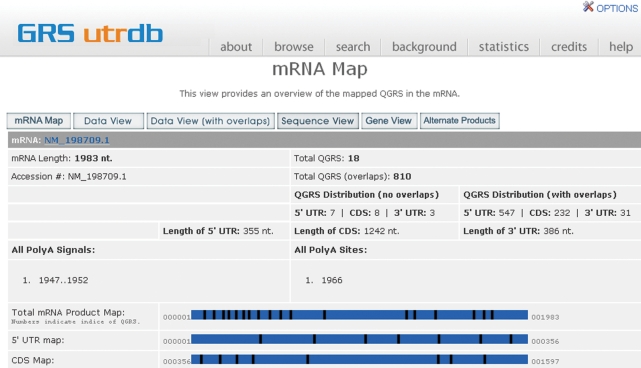
Figure 4.
GRS_UTRdb NM_198709.1 mRNA (ARSB Gene) Map. Displays basic information about the 5′ UTR, CDS and 3′ UTR and the QGRS frequency in each region. A visual map of each region is displayed with the relative positions of QGRS depicted in the map.

