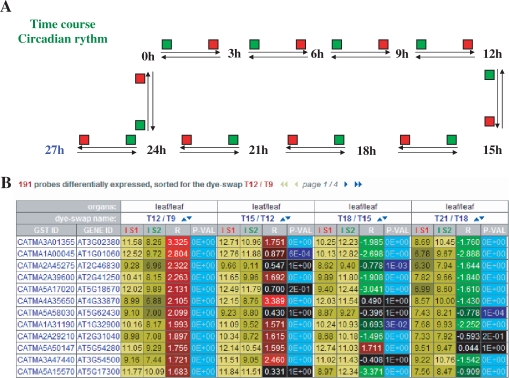
Figure 1.
Results of a query of CATdb for an experiment called ‘'C;ircadian cycle' and belonging to the project named ‘AF30_Starch_circadian_rythm’. The result includes (A) the experimental design that describes all the hybridizations with two colours, red and green, indicating the dye used for labelling each sample and (B) a table displaying for each dye-swap of the experiment and from left to right, the log2-intensities for samples 1 and 2, the log2-ratio and the Bonferroni P-value. In the example, results are sorted by the ratio values in the dye-swap between the leaf sample T12, extracted at 12 h after the start of the experiment, and the leaf sample T9, extracted at 9 h.

