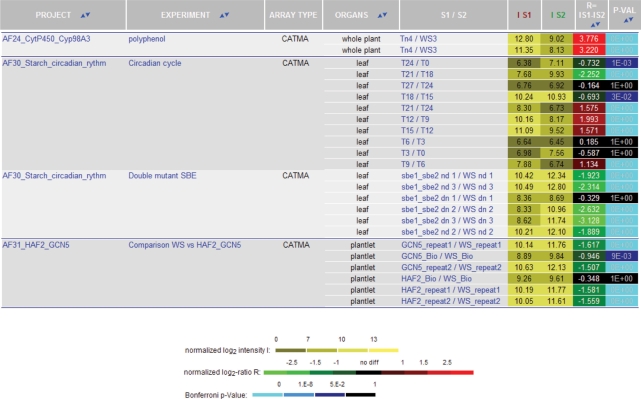
Figure 2.
Results of a query of CATdb with the name of a gene. The query was the gene AT1G32900. Data are displayed for all the projects in CATdb, but only the first four projects sorted by the Bonferroni P-values are shown here. From the left to the right, columns contain the project and the experiment names, the array type, the organ used, the sample name, the log2-intensities for both samples, the log2-ratio and the Bonferroni P-value.

