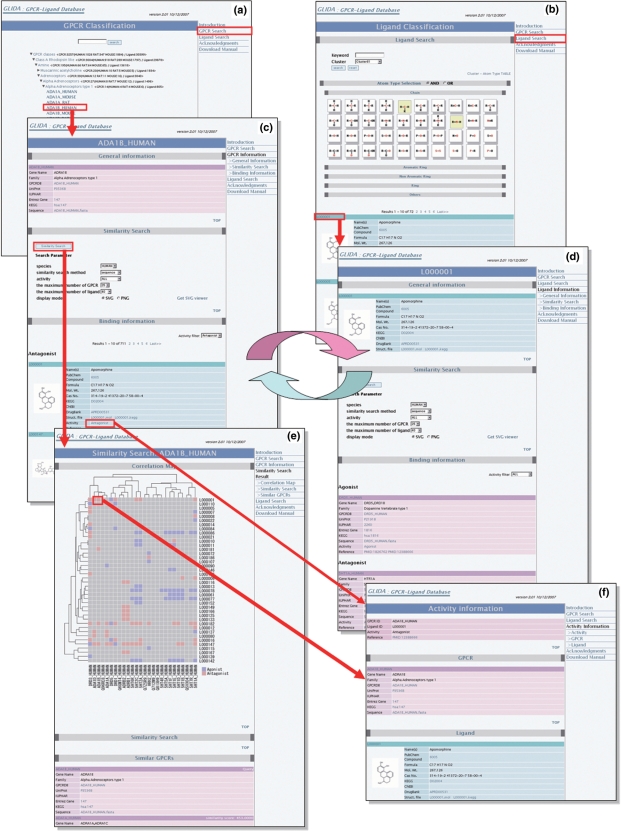
Figure 1.
A screenshot of GLIDA showing linked relations among search pages (a and b), result pages (c and d), an analytical report page (e), and a binding information page (f). The analytical report page consists of a correlation map and a list resulting from a similarity search. Red and blue colors of the spots on the correlation map indicate the ligand activities of antagonists including inverse agonist and agonists including full/partial agonist, respectively.

