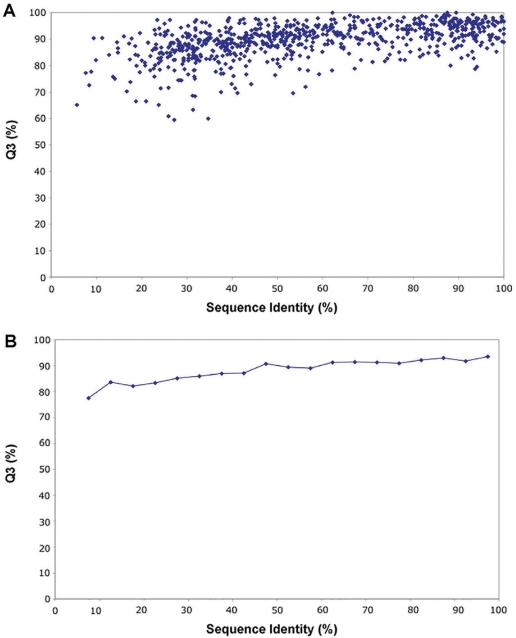
Figure 2.
(A) A scatter plot showing of the predictive performance (Q3 versus% sequence identity) for secondary structure prediction for 1000 random query sequences that were submitted to PPT-DB's secondary structure database. (B) A moving average of the same data shown in A (using 5% sequence identity intervals). Using 10-fold cross-validation (10 sets of 100 random query proteins), the average coverage was 77.1 ± 9.3% and the average Q3 for all secondary structure predictions was 89.1 ± 1.3%.

