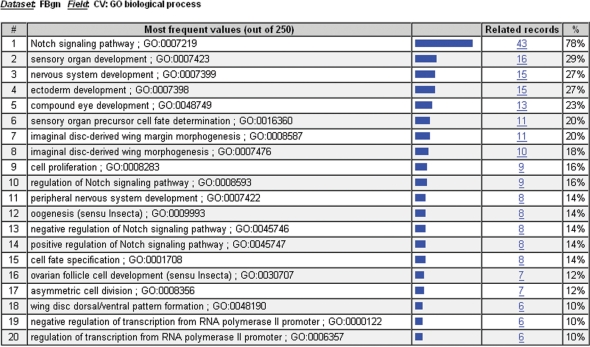
Figure 2.
Results Analysis/Refinement Tool. The Results Analysis/Refinement Tool has been used to display the distribution of Biological Process controlled vocabulary terms applied to a list of the components of the Notch signaling pathway. The second column displays the term for which the distribution was created. The next three columns show a graphical display, the raw size, and the relative size of the term in the distribution. Clicking on the number in the ‘Related records’ column will return a hit list containing the individual records that make up that bin.

