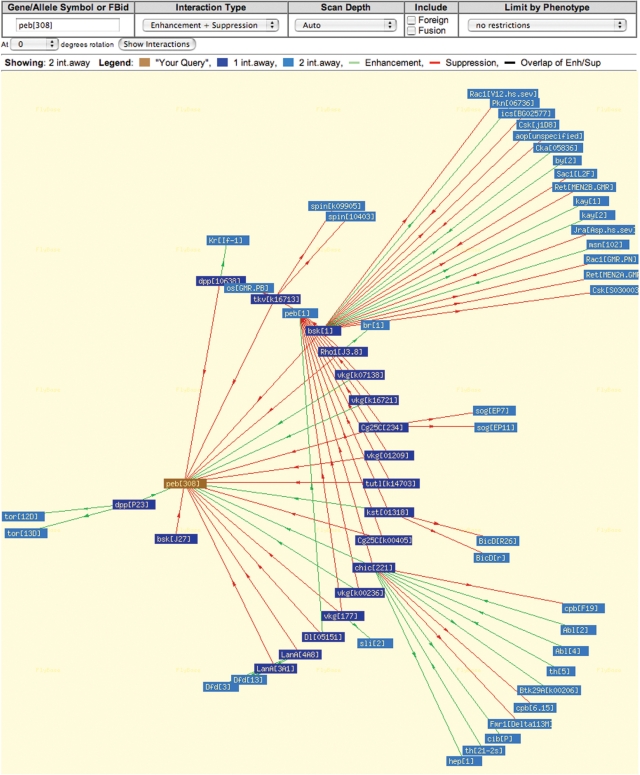
Figure 3.
Interactions Browser. The options at the top of the page of the Interactions Browser permit the selection of different types of interaction data and adjustment of the scan depth, which refers to the number of interaction steps shown from the query. The ‘auto’ value set for the scan depth by default chooses a number based on the complexity of the data. In the diagram, the alleles or genes that interact directly with the query allele or gene are shown in dark blue, and alleles or genes that interact with them are shown in light blue if the scan depth is set to 2. The program uses different colored lines to indicate the type of interaction and arrows to denote the direction in which the interaction was recorded. In some interaction diagrams that have many alleles or genes, the symbols can overlap making it hard to identify them. To view this data the picture can be redrawn in another orientation by choosing a different rotation factor.

