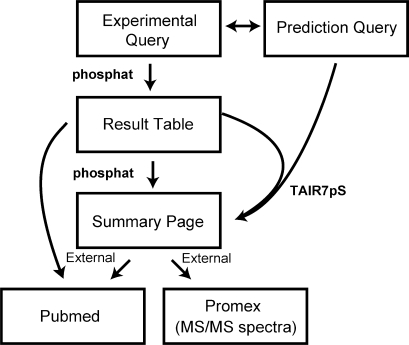
Figure 1.
Schematic diagram outlining the structure of the PhosPhAt service illustrating the two main query entry points to query experimental data and pSer prediction information. Both services merge into a common output at the ‘Summary Page’ on which the prediction results are displayed on top of the page and all experimental phosphopeptides for the given AGI code are listed below. In instances where no experimental phosphopeptides are available, only the prediction result will be displayed. External links to published references at PubMed and MS/MS data at the ProMex mass spectral library (17) are also shown.

