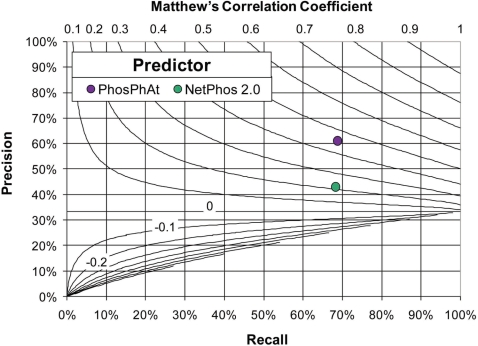
Figure 3.
Prediction performance of the pSer predictor in comparison to NetPhos 2.0 (21). The recall rate versus the associated precision is plotted. The curved lines indicate lines of equal correlation coefficient. In the diagram, improved classification performance is indicated for predictors falling into the upper right corner. Performance results for our classifier correspond to results obtained in the 10-fold cross-validation test (see Supplementary material for details.) The classifier NetPhos 2.0 was applied to our dataset without training; i.e. NetPhos 2.0 was applied to an independent dataset as it was technically not possible to perform a cross-validation for NetPhos 2.0. While the testing protocols differed, the results still suggest that a plant-specific predictor may yield better performance when applied to plant proteins than a generic predictor.

