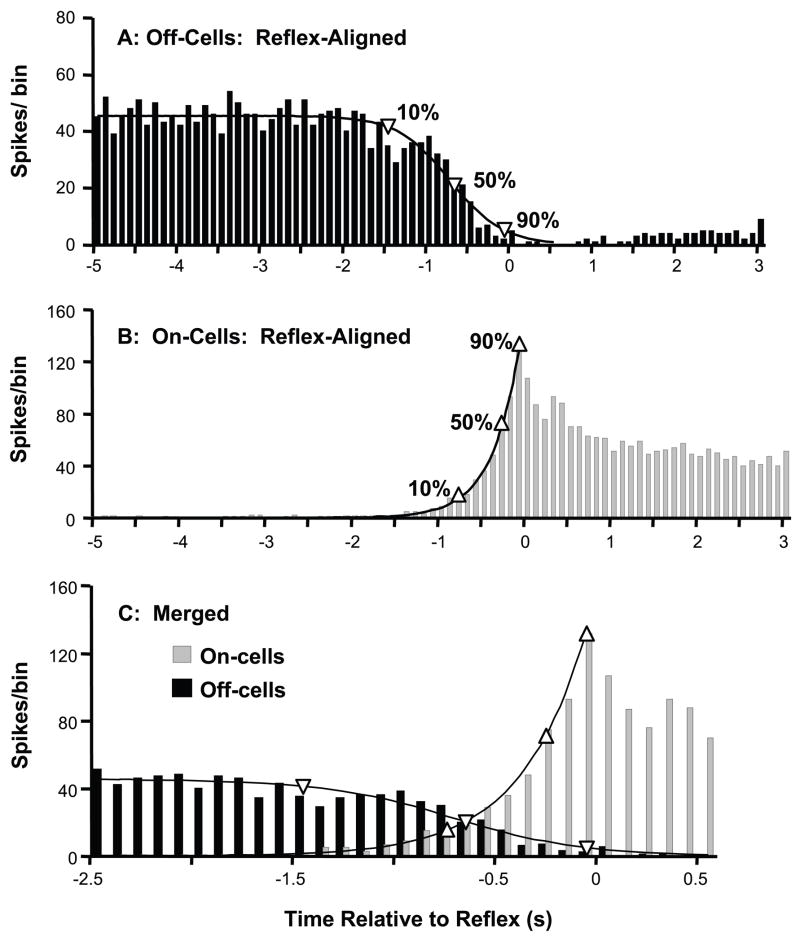
Fig. 2. Inhibition of the off-cells as a population precedes activation of on-cells.
A,B: The reflex-related decrease in off-cell firing (A, fit with a logarithmic decline), and on-cell activation (B, well described by an exponential function) are shown. Change points (90%, 50% and 10%) are marked by upward pointing triangles for on-cells and downward pointing triangles for off-cells. C: Merged data from on- and off-cells plotted on an expanded time scale. Changes in the off-cell population preceded those in the on-cell population, with both an earlier onset and half-maximal change. Bin width: 100 ms.

