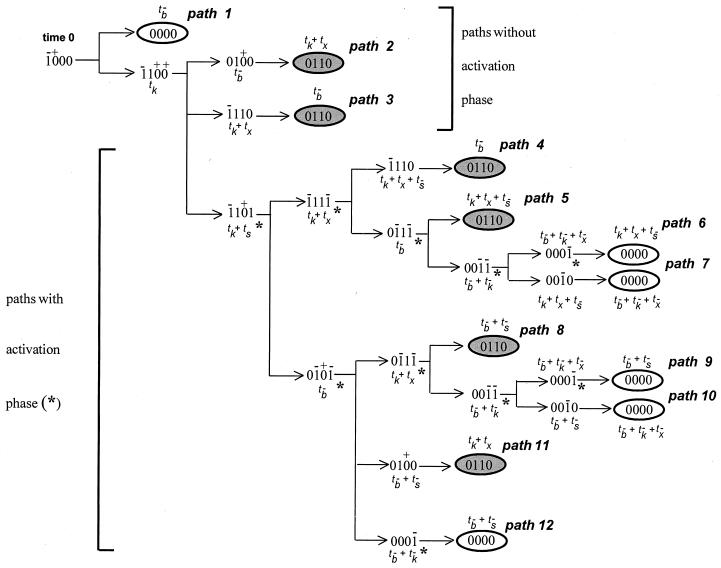
Figure 2.
Transition diagram showing the sequences of states and possible pathways. The total time to reach a given state, relative to time 0, is written next to each state in terms of the characteristic transition times (delays) of the state variables. An asterisk (∗) indicates the stages corresponding to cellular activation (s = 1).

