
Figure 2.
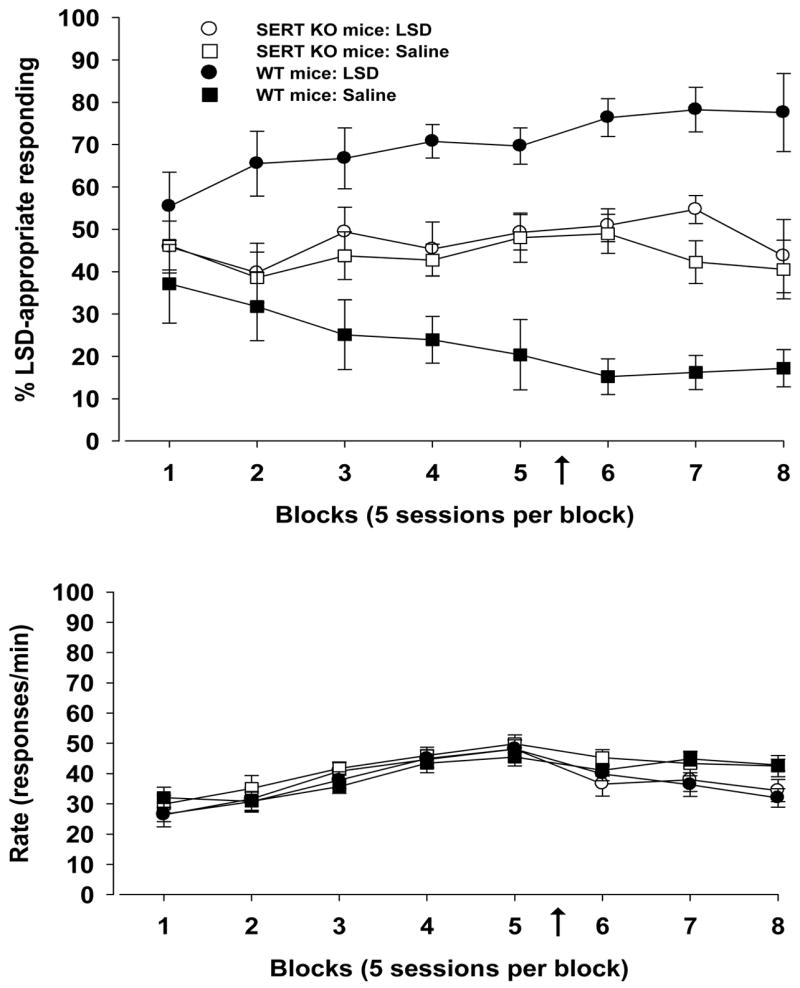
LSD-induced stimulus control and response rate for mice at two doses of LSD. Training of homozygous SERT KO mice (n = 13) and WT mice (n = 10) to discriminate LSD from saline vehicle began with 0.17 mg/kg (blocks 1–5) and continued with 0.30 mg/kg of LSD (blocks 6–8). The change in dose is indicated by the arrow. Standard errors of the mean are indicated. Ordinate: upper panel: percentage LSD-appropriate responding; lower panel: rate expressed as responses per min. Abscissa: successive data blocks of 65 sessions. Each data block represents the mean performance in 5 sessions, with the exceptions that blocks 1 are the means of 2 sessions of a given treatment, blocks 2 are the means of 3 sessions of the treatment, and blocks 8 are the means of 2 sessions of LSD and 3 sessions of saline.