
Figure 1.
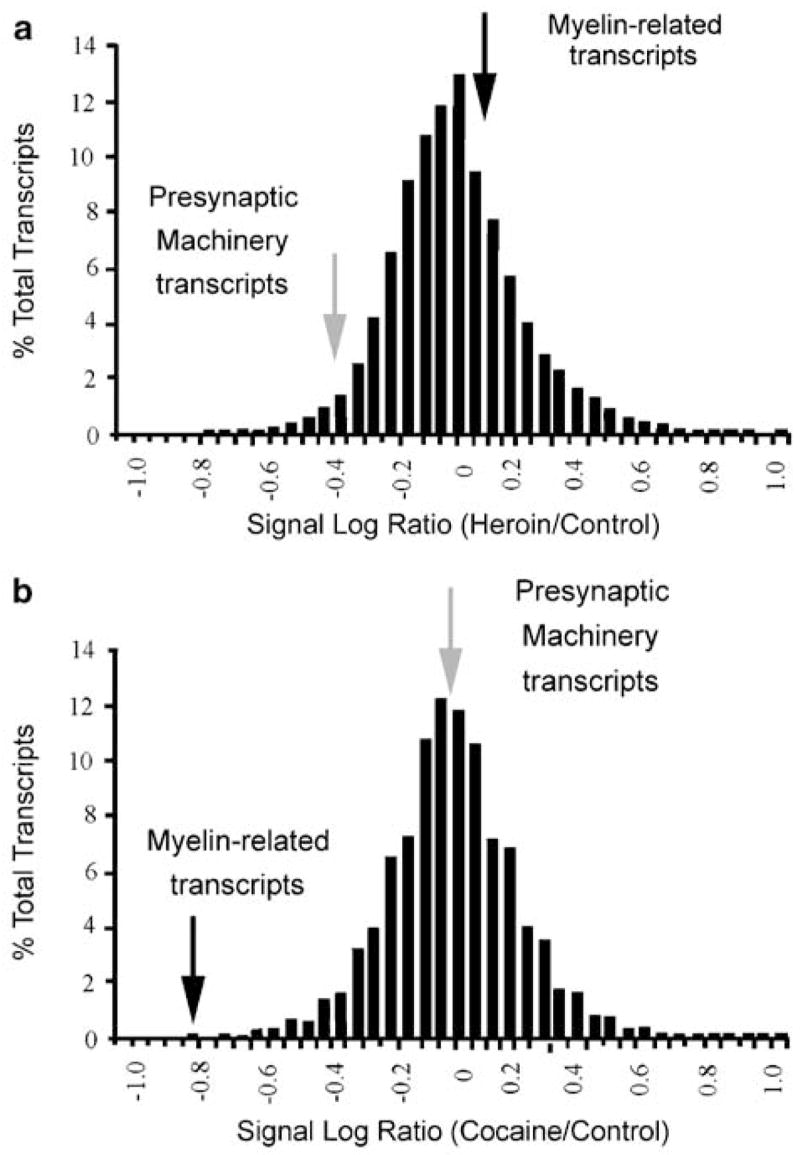
Altered transcript abundance in the nucleus accumbens of human cocaine and heroin abusers. The signal log ratio (log base 2) distribution of all transcripts detected in the majority of subject pairs was plotted after binning averages into groups of 0.05 (a:n=18 055, b:n=17 688). Values falling to the left of zero indicate a downregulation of transcript abundance in drug abusers, whereas those to the right of zero are indicative of increases. The mean signal log ratio of myelin-related transcripts (MBP, MOBP, and PLP) for each study was plotted in relation to the normal distribution of all present transcripts, and is represented by black arrows (a:mean=0.13; b:mean=−0.81). The mean signal log ratio for all presynaptic machinery transcripts (listed in Figure 2a) is represented by gray arrows (a:mean=−0.39; b:mean=−0.001). Note that the majority of transcripts are unchanged in either heroin abusers (a) or cocaine abusers (b), and that changes in myelin-related and presynaptic machinery transcripts are drug specific.