
Figure 5.
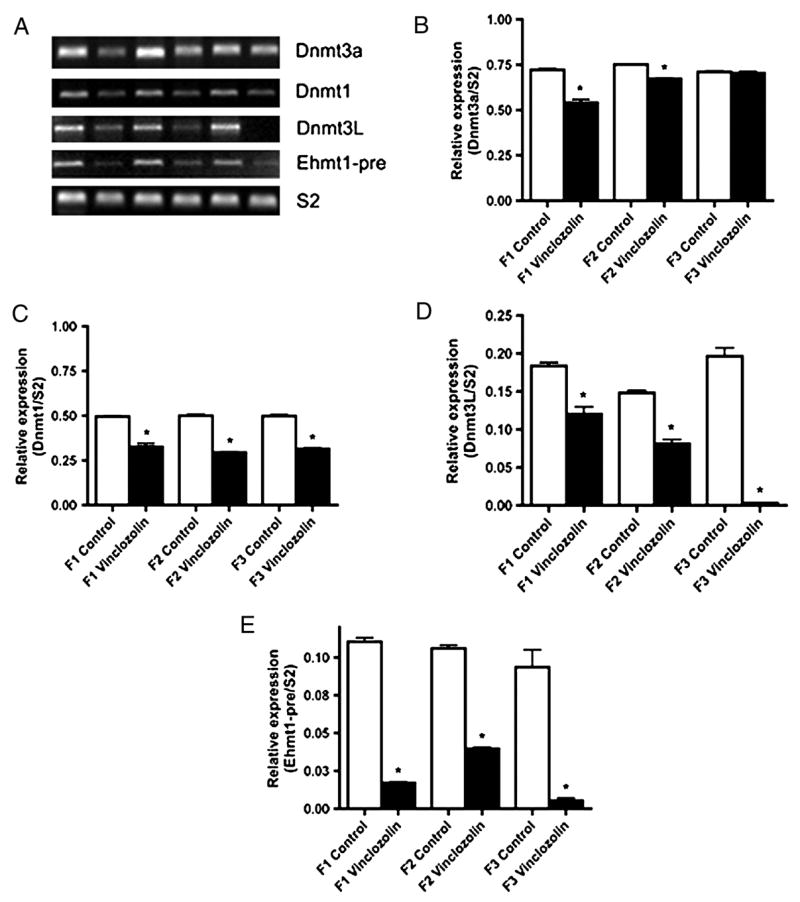
Semi-quantitative PCR analysis of (A & B) Dnmt3A, (A & C) Dnmt1, (A & D) Dnmt3L, (A & E) Ehmt1, and (A) the constitutively expressed S2. A representative electrophoretic gel of the PCR products is presented (A) and the combined data from 3 different experiments with normalization to S2 presented (B–E). The mean ± SEM is presented with asterisks (*) indicating a statistical difference (p<0.05) between control and vinclozolin generation F1-F3 E16 expression levels.