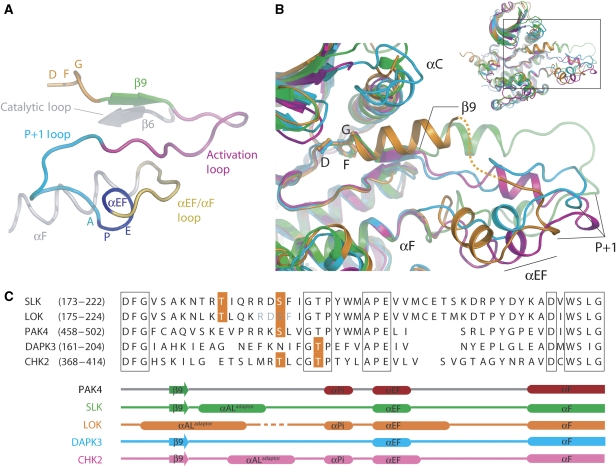
Figure 3.
Conformation of activation segments. (A) Activation segment nomenclature. Schematic representation of the typical architecture of a kinase activation segment based on the active mono-phosphorylated STE kinase PAK4 (PDB: 2CDZ). The activation segment region runs from the magnesium-binding DFG motif (orange) to the αF helix (grey). The β9 strand (green), the activation segment (magenta), the P+1 loop (turquoise), APE (αEF) helix (blue) and αEF/αF loop (yellow) are highlighted. (B) Comparison of the activation segments of SLK (green), LOK (orange), DAPK3A (cyan) and CHK2 (magenta; PDB: 2CN5) after superimposition. The activation segments adopt a spectrum of orientations that are dictated by the relative orientation of each monomer with each respective dimer. The disordered region of LOK is indicated by a dotted line. For DAPK3, the activation segment from molecule B is shown as the corresponding region in molecule A is disordered. Inset: overall superposition of kinases indicating area of interest shown in main panel. (C) Structure-based sequence alignment of activation segment regions. The sequences of the activation segments of SLK, LOK, DAPK3, CHK2 and PAK4 are shown. Known phosphorylation sites are highlighted in orange. Secondary structure elements are shown for each kinase below the alignment and coloured using the same scheme as in panel B. The structural elements of PAK4 (PDB: 2CDZ), in which the activation segment adopts a classical intramolecular orientation, are shown for reference.

